
Qualitative vs quantitative research: the difference, and how to choose
Qualitative research explains why people act, while quantitative research counts how many do. Compare them and choose from the decision you have to make.
October 1, 2026
Godefroy
- Qualitative research collects answers in the words people chose, so you learn why something happens. Quantitative research fixes the form of the answer in advance, so you can count how often it happens.
- Base the choice on the decision you have to make. When you cannot yet write the answer options, run a qualitative study first.
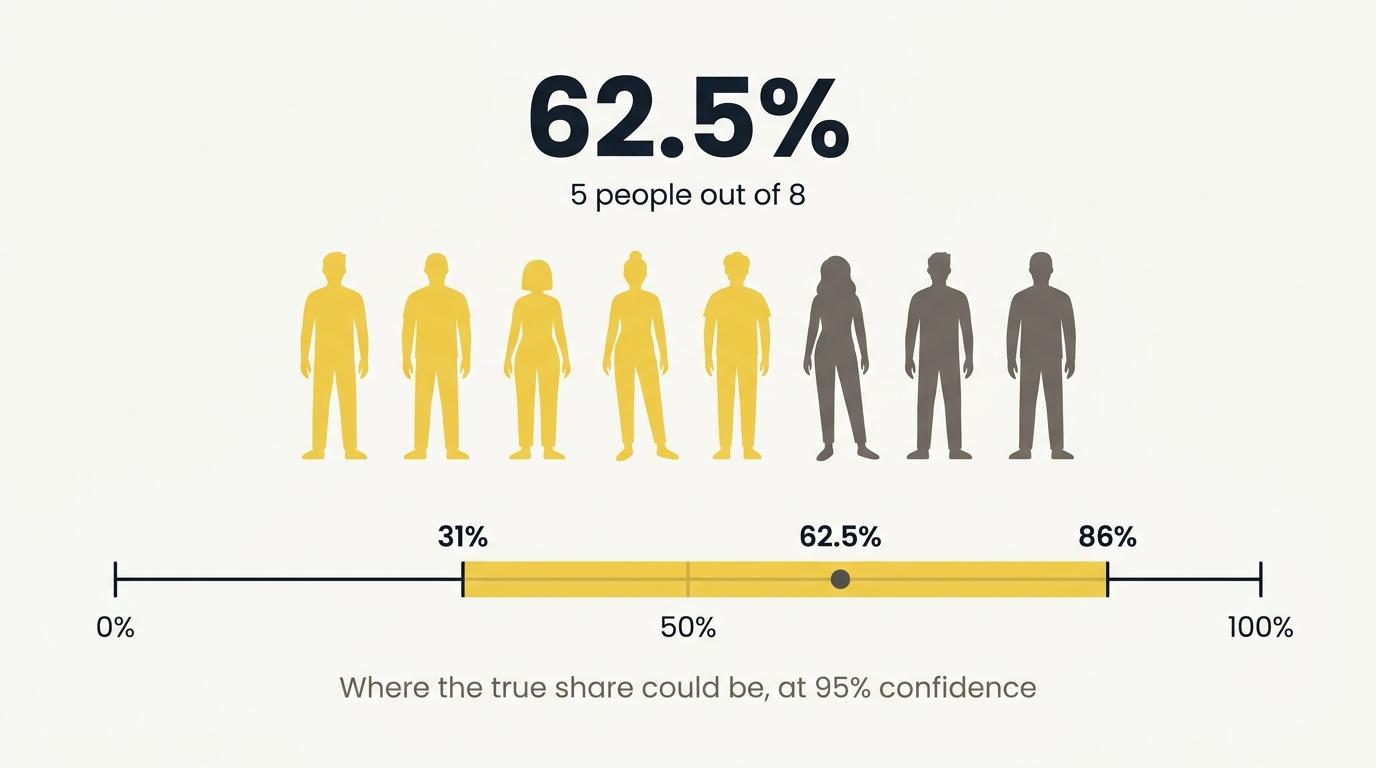
- A handful of interviews gives you reasons, never a percentage. Five people out of eight is 62.5%, but the true share could sit anywhere between 31% and 86%.
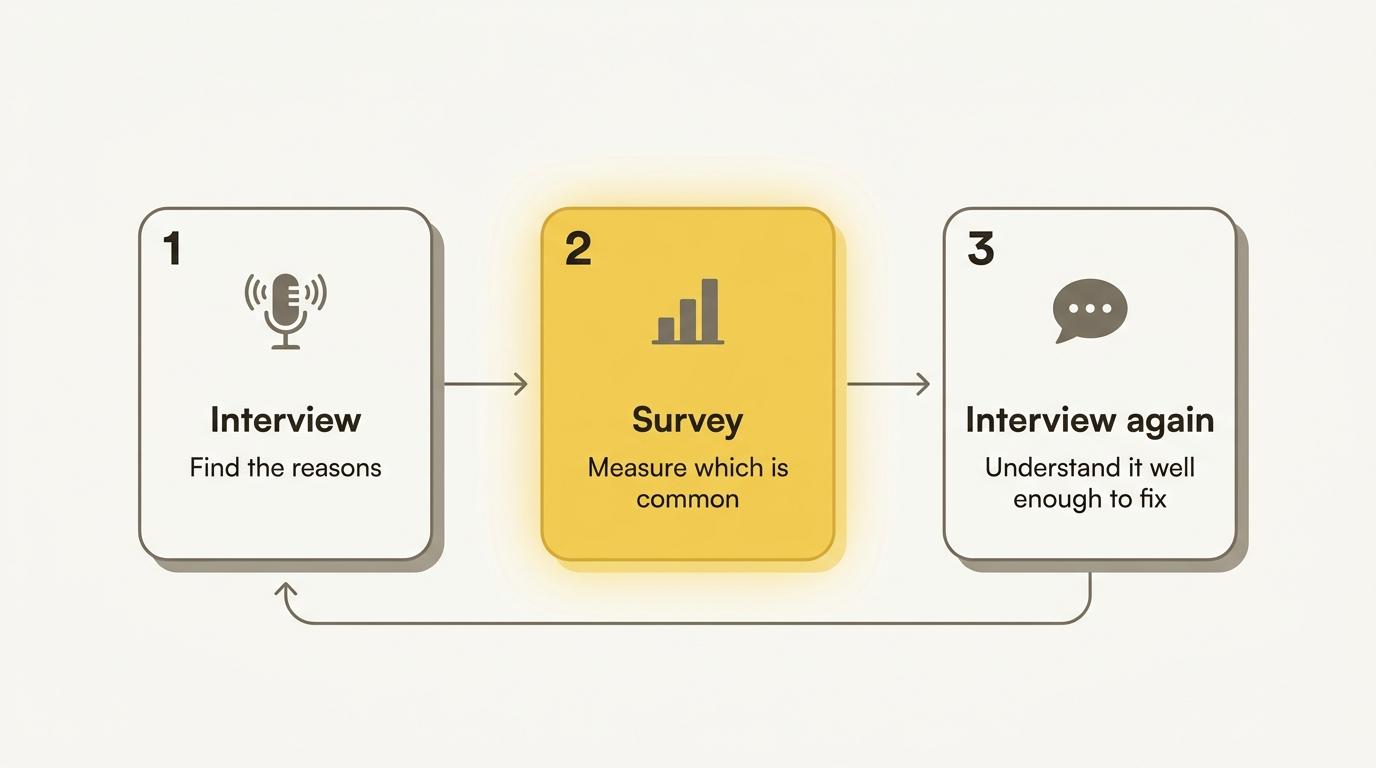
- Mixed methods work best as a loop: interviews to find the hypothesis, a survey to measure it, then interviews again to explain the result.
- A hundred interviews are still qualitative research. You can count how many people raised a theme, but they chose what to raise, so the count is a minimum: others may share the theme without having brought it up.
Qualitative research tells you why people do something, from a small number of people talking in their own words. Quantitative research counts how many do it, across a large sample. What separates them is who decides the form of the answer: the person answering, or you, when you write the options before anyone replies. Base the choice on the decision you have to make. Most studies that hold up end up using both, in a set order. This page puts them side by side, shows how to pick, and covers the mistakes that make a study answer a question nobody asked.
The difference comes down to who sets the form of the answer
Qualitative research collects what people say or do in the form they chose. You then read it to understand why. Quantitative research collects answers whose form you fixed in advance (a rating, an option from a list, a number), which you count to learn how many, how often or how much.
The test takes a second. If two people who mean the same thing produce the same value in your spreadsheet, the data is quantitative. If you have to read one answer against the next to know what it says, the data is qualitative. “How satisfied are you, from 1 to 5?” passes the first test. “Tell me about the last time you exported a report” passes the second.
A study is named after the data it relies on. A survey with one open text box at the end is still a quantitative study, and an interview where you ask someone’s age is still a qualitative one.
What each approach answers, and its blind spot
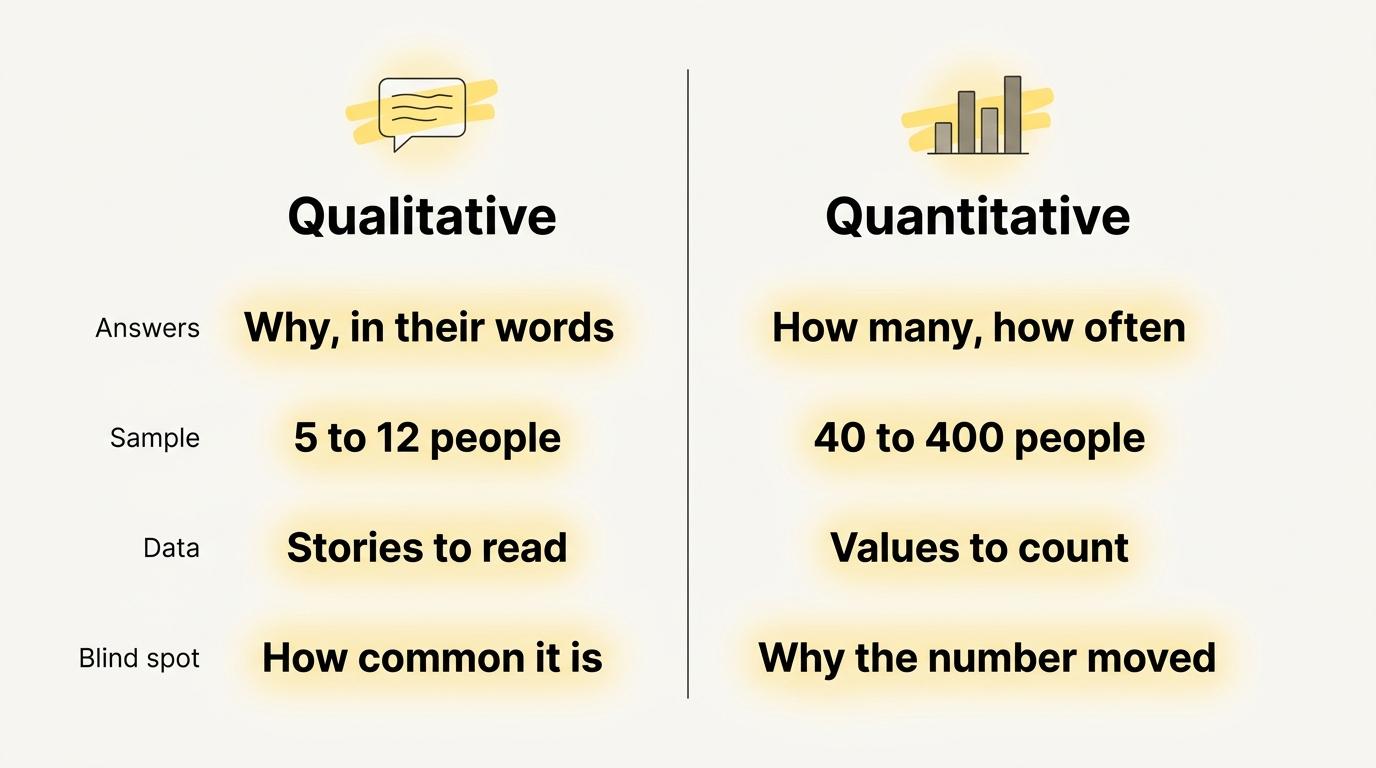
A qualitative study answers why something happened, how it came about, which words people use for it, and what you had not thought to ask. Eight people describing the same frustration show you that it exists and what triggers it. Whether it touches 5% of your users or 60%, you would need a count to know.
A quantitative study answers how many, how often, how much, whether two groups differ, and whether a change moved a number. It leaves you to find out elsewhere why the number moved, and measures only the options you thought to offer. The survey methodologists Howard Schuman and Stanley Presser asked people what matters most in preparing children for life. With “to think for themselves” in the list, 61.5% picked it, while without a list, only 4.6% said anything of the kind. People stay inside the options they are given, which is why a survey written before you understand the problem measures your own assumptions.
The two also differ in what they cost the person answering. The Pew Research Center, an American polling institute, reported in 2021 18% nonresponse on open-ended questions against 1% to 2% on closed ones on its American Trends Panel. Ticking a box takes no writing, so people answer it. For the same reason, the answer explains nothing.
Qualitative vs quantitative research, side by side
| Qualitative research | Quantitative research | |
|---|---|---|
| Question it answers | Why, how, in which words | How many, how often, how much, do two groups differ |
| Typical sample | 5 to 12 people per segment | 40 people for a usability metric, around 385 for a proportion within 5 points |
| Data you get back | Transcripts, recordings, notes, open answers | Ratings, choices, counts, logged events |
| What you can conclude | Which reasons exist and how they fit together | How widespread something is, with a margin of error |
| How you analyse it | Reading, coding, building themes | Counting, cross-tabulating, testing for differences |
| Cost per participant | High: a conversation, then transcription and reading | Low: the work goes into writing the questions once |
| Time to first result | Days, as conversations get run and read | Hours, as soon as responses come in |
| Blind spot | How common a reason is | Any answer outside the options you wrote |
The sample sizes come from what each approach is trying to do. Raluca Budiu, at the UX consultancy Nielsen Norman Group, explains why five participants are fine for a qualitative usability study and not for a quantitative one. Five people are enough to find most of the problems in an interface, while a metric such as a success rate needs about 40 before its confidence interval gets narrow enough to be useful. For a survey, 385 respondents put a proportion near 50% within about 5 points either way, at 95% confidence, however large your population.
Qualitative samples stay small for a different reason, saturation: after a dozen interviews with a homogeneous group, new themes stop appearing. We explain where that number comes from alongside the main qualitative research methods, and how to read the transcripts with a thematic analysis.
How to choose: start from the decision you have to make
Write down the decision the study has to inform, then ask what you would need to know to make it. If you need a reason, run a qualitative study. If you need a size, run a quantitative one. If you cannot yet write the answer options for a survey, you do not understand the problem well enough to count it, so start with interviews.
Take three common decisions:
- “Should we rebuild onboarding?” You need to know why people stall before you know what to rebuild. Interview ten people who stalled, then check in your analytics how many accounts stop at the step they described.
- “Which of these two pricing pages converts better?” This is a size question with known options. Run an A/B test. Interviews would only collect opinions about pricing pages. People’s opinions predict very little about what they then do on a page.
- “Why did cancellations rise in March?” You already have the number. Another survey would give you a second number. Talk to the people who cancelled.
Teams usually pick the method they used last time, because the survey template exists or the interview guide is still in a folder. Start from the decision instead and you break that habit. You also see when you need no study at all: if no possible answer would change what you do, skip the research.
graph TD
  A["What decision does this study inform?"] --> B{"Do you need a reason or a size?"}
  B -->|"A reason"| C["Qualitative: interviews, usability tests, diary studies"]
  B -->|"A size"| D{"Can you write the answer options?"}
  D -->|"Yes"| E["Quantitative: survey, analytics, A/B test"]
  D -->|"No"| F["Qualitative first, to find the options"]
  F --> E
  E --> G{"Did the number surprise you?"}
  G -->|"Yes"| H["Qualitative again, to explain it"]
  G -->|"No"| I["Decide"]
Mixed methods, and the order that works
Mixed methods research combines both approaches in one study. The order you run them in matters more than the mix. Michael Fetters, Leslie Curry and John Creswell, three mixed methods researchers, describe the main designs in a 2013 paper in Health Services Research:
- In an exploratory sequential design, you collect and analyse qualitative data first, and its findings shape the quantitative data you collect next.
- In an explanatory sequential design, the quantitative data comes first, and the qualitative phase explains what it found.
- In a convergent design, you collect both over the same period and compare them at the end.
Product teams get the most out of chaining the exploratory and explanatory designs into a loop. Say people stop using an export feature after a month.
- Interview ten of them about the last export they ran. You come back with three reasons, described in their words.
- Turn those three reasons into the options of a survey sent to every account that stopped exporting. Now you know which reason is the common one.
- Interview a handful of the people who picked that reason, to understand it well enough to fix it.
Each step answers the question the previous one raised: the interviews give the survey options you would not have guessed, the survey shows which reason to work on, and the follow-up interviews turn its percentage into a problem a team knows how to fix. Draft the interview guide from a bank of open-ended questions and the survey from the usual formats of quantitative research questions.
Why qualitative research did not scale, and what changed
Qualitative research stayed small because the work never got cheaper per person: every new conversation cost as much as the first. You recruit someone, find a slot both of you can make, run a 45-minute call with someone taking notes, then transcribe it. Transcribing a one-hour interview by hand takes 5 to 10 hours, according to the qualitative methods textbook by Udo Kuckartz and Stefan Rädiker. Jakob Sponholz, at the University of Cologne, and two colleagues measured a doctoral student correcting automatic transcripts instead, and found 2 hours 19 minutes of work per hour of interview.
So teams ran six interviews and sent six hundred surveys: the budget chose the method before anyone looked at what the question needed. Whenever a question needed more than a few people, the survey was the default.
Automatic transcription first removed most of the hours after the call. Then interviews themselves stopped needing a live interviewer. With Raconte, you write what you want to learn once, as a brief, and send a link. The person opens it in their browser whenever it suits them and talks for a few minutes. The AI listens, follows up when an answer stays vague, and stops once your topics are covered. Each interview comes back with the transcript, the audio, a summary and the sentiment of each message, plus aggregated reports once several people have answered the same brief. The API and the MCP server send all of it to your own tools or to an agent.
Even with an AI running them, a hundred interviews are still qualitative research: you can count how many people raised a theme, but each person chose what to raise, so the count is a minimum. Others may share the theme without having brought it up. Run a survey when you need the real share. An AI also works from the voice alone, so it misses the look on someone’s face. For a sensitive subject or a negotiation, keep a human interviewer. What the AI changes is the size of the sample: a team that stopped at six interviews because the calendar allowed no more can talk to sixty people in the same week.
Mistakes that make a study answer the wrong question
Putting a percentage on eight people
Five people out of eight is 62.5%, a number that looks precise. Its 95% confidence interval runs from 31% to 86%, so the real share among your users could be under a third or above four in five. Put a percentage on a qualitative sample and the reader believes you measured a share, when you only counted eight people. Write “five of the eight people we spoke to” and spend the space on what those five said.
Adding an open question to a 40-item questionnaire and never reading the answers
The optional box at the end, “anything else you would like to tell us?”, feels like a cheap way to get the why. Most people leave it blank, the ones who fill it write five words, and nobody can ask them what they meant. The answers then sit in a column that nobody codes because there are three hundred of them and no time set aside. Either plan the hours to read them, or drop the box and invite twenty respondents to a conversation instead.
Surveying before you know the options
A survey written from the team’s own guesses can only rank those guesses. When the real reason is missing from the list, people pick the nearest option, which looks exactly like a true answer in your results. If you cannot name the likely answers from things users actually said, the interviews come first.
Asking people what they would do
“Would you pay for this?” gets an answer in an interview and in a survey alike, but neither answer predicts what people will do. Rob Fitzpatrick, the author of The Mom Test, built a whole interviewing method on asking about specific past events instead of future intentions. The same goes for surveys: ask “how many times did you export a report last month?”, which you can check in your analytics, rather than “how likely are you to export more?”.
Where to start
Take the question your team is arguing about this week and write the decision it feeds. Then ask whether the decision needs a reason or a size. For a reason, plan five to twelve conversations with the people concerned. A size takes a survey or your analytics, once you can write the options in your users’ words.
If you are missing the reason and the calendar keeps you from running the interviews, Raconte runs the conversations for you: one brief, one link, and the transcripts come back as people answer. The first 60 interview minutes each month are free, with no card. After that, you pay per interview minute.
Frequently asked questions
What is the main difference between qualitative and quantitative research?
Qualitative research collects answers in the form people chose, such as interviews or open answers, and you read them to understand why something happens. Quantitative research collects answers whose form you fixed in advance, such as ratings, choices or counts, and you count them to learn how many, how often or how much.
What is the difference between qualitative and quantitative data, with examples?
Quantitative data is a value you can add or average: a satisfaction score of 4 out of 5, 12 support tickets in a month, 38 minutes in a session. Qualitative data is material you read: an interview transcript, a recording of someone using your product, an open answer such as “I rebuilt the file by hand because it opened in the wrong tool”.
Is a survey qualitative or quantitative?
A survey is quantitative when its questions are closed, which is the usual case: ratings, single or multiple choice, numbers. An open text question inside a survey collects qualitative data, but in small amounts and with no way to follow up, so the survey as a whole stays a quantitative instrument.
Is an interview qualitative or quantitative?
Most interviews are qualitative: open questions, follow-ups, and answers in the person’s own words. A structured interview, where the interviewer reads the same closed questions to everyone, as in a telephone poll or a census, is quantitative. To run the open kind, follow the steps to conduct a qualitative interview.
Which is better, qualitative or quantitative research?
Neither is better in general. Qualitative research is better when you need to understand a reason or when you cannot yet write the answer options. Quantitative research is better when you need to know how common something is or whether a change moved a number. Most decisions need both, run one after the other.
How many participants do qualitative and quantitative studies need?
A qualitative study usually needs 5 to 12 people per segment, because new themes stop appearing after about a dozen interviews with a homogeneous group. A quantitative usability metric needs around 40 participants, and a survey needs around 385 respondents to estimate a proportion within 5 points at 95% confidence.
What is mixed methods research?
Mixed methods research combines qualitative and quantitative data in one study. In an exploratory sequential design, interviews come first and shape a survey. In an explanatory sequential design, the survey comes first and interviews explain its results. In a convergent design, both run at the same time and get compared at the end.
Can you turn qualitative data into numbers?
You can count how many interviews mention a theme once you have coded them, and that count is worth reporting. It stays a description of your sample: the people chose what to raise, so a theme mentioned by 4 people out of 10 exists and matters to at least those four. To find out whether 40% of your users share it, run a survey built on that theme.


