
A customer satisfaction survey example, and why the score is not enough
A customer satisfaction survey template you can copy, what every question tells you, and the four blind spots of a score out of 10.
August 19, 2026
Godefroy
- A customer satisfaction survey tracks a trend on a stable population well. It rarely explains what produced the score.
- Between 65% and 85% of customers who switch suppliers described themselves as satisfied or very satisfied right before they left. A good score says little about who will stay.
- Only an open question tells you which change would move the score back.
- An open-ended question draws 18% nonresponse against 1% to 2% for a closed one. The free-text box is the first thing respondents skip.
- An asynchronous voice conversation recovers the why a form loses, with no slot to book and no interviewer to free up.
The report lands on the first Monday of the quarter. The overall score is 8.4 out of 10, up 0.2 points. Everyone reads it, and nobody knows which decision it supports.
The survey did its job, though. It measured. Then it gets asked to explain, and a checkbox explains nothing.
This article gives you a customer satisfaction survey template to copy, question by question, with what each one tells you. After that come the four blind spots of a closed format, and how to get what it leaves out another way.
What a satisfaction survey is actually for
A satisfaction survey does two things well. It tracks a trend on a stable population, so it tells you something moved between March and June. And it catches an incident, because a score that drops on one segment shows up straight away.
Nobody learns why the score is what it is.
Teams measure satisfaction with three metrics, and each one answers a different question.
| Metric | The question asked | What it covers | Its limit |
|---|---|---|---|
| CSAT | ”How satisfied are you with X?”, 1 to 5 | Satisfaction with one specific interaction, measured while it is fresh | Loses its meaning once you stretch it over the whole relationship |
| NPS | ”How likely are you to recommend X?”, 0 to 10 | Intent to recommend, reputed to predict growth | Says nothing about the reason behind the score |
| CES | ”How much effort did you have to put in?”, 1 to 7 | Friction in one journey (support, delivery, signup) | Says nothing about the perceived value of the product |
NPS is the most widespread of the three and the most contested. Timothy Keiningham, Bruce Cooil, Tor Wallin Andreassen and Lerzan Aksoy replayed the original demonstration on 21 firms and more than 15,500 interviews from the Norwegian Customer Satisfaction Barometer, then published the result in the Journal of Marketing in 2007: the claimed superiority of NPS over classic satisfaction measures does not replicate, including in the industries cited as exemplars. NPS keeps its use as a tracking metric. A strategic decision needs something else.
A commented customer satisfaction survey example
The template below fits a product or service sold on subscription, and you can transpose it by swapping the names. It has ten questions and takes three minutes to fill in. Each row says what the question really returns and what it does not say.
| # | The question | What it tells you | Its limit |
|---|---|---|---|
| 1 | ”On a scale of 0 to 10, how likely are you to recommend [product] to a colleague?” | A series you can compare quarter to quarter | The same 8 comes from contrary reasons |
| 2 | ”Overall, how satisfied are you with [product]?” (1 to 5) | The general level, readable across the whole company | Flattens the gap between a 4 and a 5, which behave differently |
| 3 | ”Did your last exchange with support take little or a lot of effort?” (1 to 7) | Friction on one precise journey | Only covers the people who went through support |
| 4 | ”How long have you been using [product]?” | The split by tenure, needed to read every other answer | None in itself |
| 5 | ”How often do you use it?” | The crossing of usage and satisfaction, often the most informative | Self-reported, so overstated |
| 6 | ”Which part of [product] do you use most?” (list + Other) | The features that matter | The list comes from you, so it bounds the answer |
| 7 | ”Rate speed, price, reliability and ease of learning separately.” (1 to 5) | The weak spot the overall score does not show | Four attributes picked in advance |
| 8 | ”What almost made you give up?” (free text) | The friction nobody thought to list | Left blank far more often than a closed question |
| 9 | ”What would a colleague need before adopting [product]?” (free text) | The objection stated on someone else’s behalf, easier to write down | Same completion problem |
| 10 | ”May we get back to you about this?” (yes/no + email) | Who is willing to talk again | Selects the most engaged |
Presenting the survey takes two sentences before the first question: who is asking, why, how long it takes, and where the answers go. Send it within 24 to 48 hours of the event you are measuring, keep it to twelve questions at most, and state the real duration rather than an optimistic one. A survey announced at two minutes that takes seven loses respondents halfway, and leaves you only the answers of the most patient. For a shorter form tied to one moment, such as a support ticket or a cancellation, start from the customer feedback form templates instead.
The five levels of satisfaction are very dissatisfied, dissatisfied, neutral, satisfied and very satisfied. Habit says you add satisfied and very satisfied together under a “satisfied” label. Thomas Jones and Earl Sasser measured at Xerox that very satisfied customers repurchased six times more than merely satisfied ones. Summing the two levels loses the one distinction on the scale that predicts a behaviour.
The four blind spots of a closed format
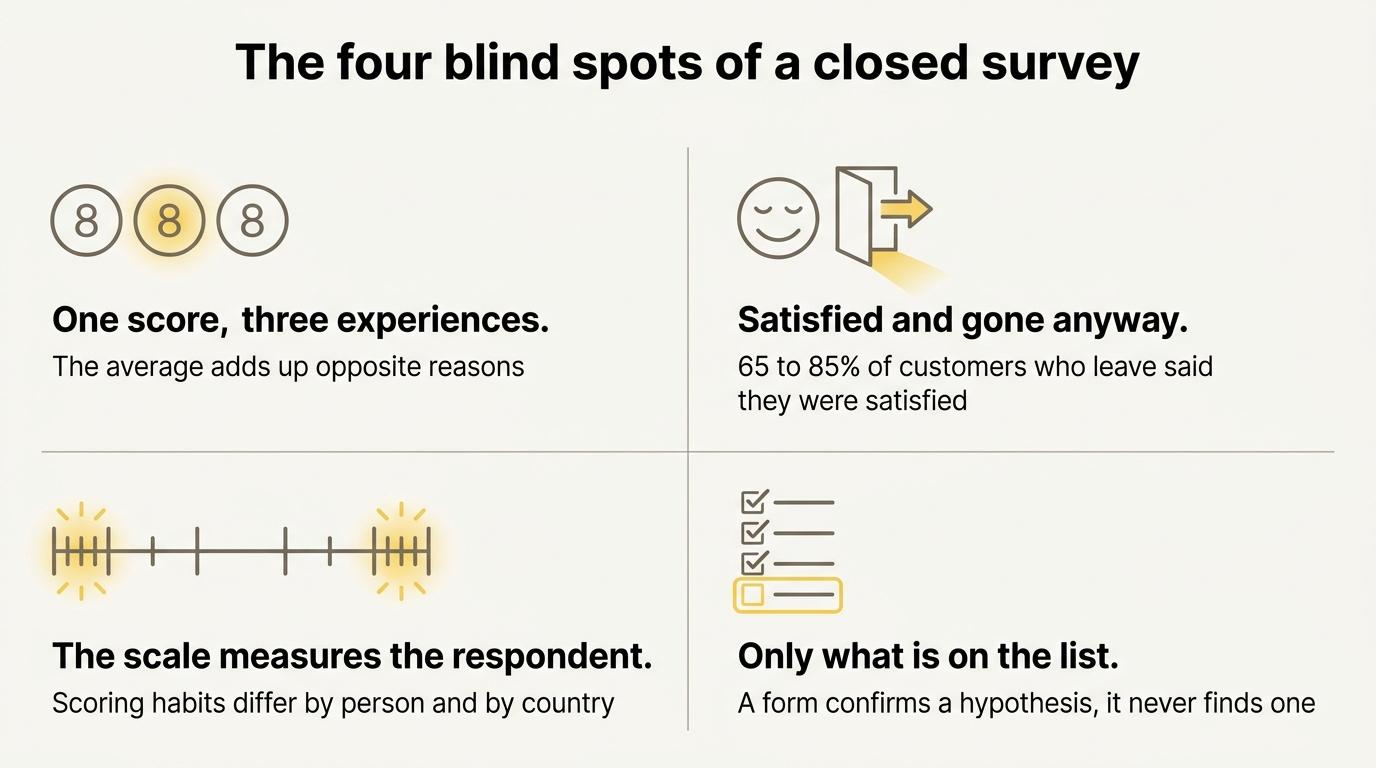
The same score comes from opposite experiences
Three people give an 8. The first finds the product excellent and the price too high. The second uses it twice a month and holds no strong view. The third had an incident, handled well, and is rating the support team rather than the product. The average adds them together and returns 8. Each of those three situations calls for a different decision, and the score shows none of them.
Satisfied customers leave anyway
Thomas Jones and Earl Sasser published an analysis in the Harvard Business Review in 1995 that has stayed famous, Why Satisfied Customers Defect: between 65% and 85% of customers who switch suppliers described themselves as satisfied or very satisfied right before leaving. Stated satisfaction and actual loyalty are separate, and the survey only measures the first.
The scale measures the respondent too
Response styles vary from one person to the next and from one country to the next. Some groups pick the ends of the scale, others stay in the middle, and acquiescence pushes part of your respondents toward whichever answer suits the sponsor. Cross-cultural research has documented these gaps long enough to fill a textbook chapter. On a customer base spread across several markets, part of the gap between two countries comes from the scale rather than from the service delivered.
You only learn what you thought to ask
A closed list returns the items it contains and nothing else. The reason your customers leave is missing from it, because you do not know that reason yet. A survey confirms or refutes hypotheses. It produces none of its own. Four quarters of measurement give you four measurements of the same hypothesis.
The open-ended question nobody fills in
The usual fix is a free-text box at the end of the survey. It is supposed to give you the why, and it is the one respondents skip.
The Pew Research Center measured this nonresponse across 92 open-ended questions spread over more than 40 surveys on its American Trends Panel between 2018 and 2021. The average there reaches 18% on an open-ended question against 1% to 2% on a closed one, and it passes 50% on some wordings. Pew works with a paid panel that answers these questions all the time. On a customer survey sent cold, the gap widens.
The answers you do get are short. “Nothing to report”, “all good” and “too expensive” fill a good share of free-text boxes, and none of those three turns into an action. Nobody will ever know what that “too expensive” was measured against, or at which point in the decision it landed. A form does not follow up.
Make people talk instead of tick
A ten-minute conversation with a customer answers everything the survey leaves open. It also costs a slot to book, an interviewer who is free, and someone taking notes. That is why teams run a handful of interviews a year and send surveys to five thousand people.
That cost is what we set out to remove with Raconte. You write the interview once as a prompt, then you send a link. The person opens it in their browser whenever it suits them and talks for a few minutes. The AI listens, follows up as soon as an answer stays vague, and stops once it has asked everything you listed. Nobody books a slot.
The whole difference sits in the follow-up. “Too expensive” calls for a follow-up question, and the follow-up question is what gives you the information. In writing, nobody asks it. In a voice conversation, it arrives a second later.
| Survey | Phone interview | Asynchronous voice interview | |
|---|---|---|---|
| Reachable volume | The whole base | Five to ten a week | The whole base |
| Follow-up on a vague answer | None | Yes | Yes |
| Slot to book | No | Yes | No |
| Depth obtained | A score and two words | High | High |
| Comparable over time | Yes | With difficulty | Yes |
| Cost of one more respondent | Close to zero | Half an hour | The minutes spoken |
You get the transcript, the audio, a summary and per-message sentiment within seconds of each conversation, plus aggregated reports as soon as several people have gone through the same brief. If the answers need to reach your CRM or be used by an agent, the API and the MCP server push them there with no manual export.
The first 60 interview minutes of every month are free, no card required, and the minutes after that are billed as you use them. The pricing page has the detail.
When a survey is still the right tool
Four cases call for a measurement rather than an explanation, and a survey covers all four.
- Tracking a numeric trend on a large population, quarter after quarter, with the same wording.
- Spotting an incident fast, on one segment, with nothing to read.
- Benchmarking against an industry index, which imposes its scale and its questions.
- Measuring how often a behaviour you already understand occurs.
The wordings for those four jobs are grouped by format in the bank of 40 closed questions, each one paired with what it leaves out. Among them, a dichotomous question, which offers two options such as yes and no, is enough to count the customers who contacted support or finished the setup. You can ask these questions in Tally or Google Forms, which have no monthly response cap, unlike Typeform. If the survey has to run inside your product or across every channel of a large company, an in-app tool or a voice of the customer platform fits better than a form builder. The score you get from these tools is one input of a voice of the customer program, next to support tickets, reviews and interviews.
A survey turns into a problem the day you ask it for the explanations it does not collect, then conclude there was nothing to learn. Employee surveys hit the same limit: an engagement survey shows which team scores low, never why.
To collect those explanations, choose the customer research method that fits what the customer is doing: a feedback interview while they use the product, a churn interview when they cancel.
graph TD
  A["What are you after?"] --> B{"A measurement or an explanation?"}
  B -->|"A measurement"| C{"On which population?"}
  C -->|"The whole base"| D["Quarterly survey"]
  C -->|"One precise journey"| E["A single question after the event"]
  B -->|"An explanation"| F{"How many people?"}
  F -->|"Fewer than ten"| G["Interview run by a human"]
  F -->|"Ten to several hundred"| H["Asynchronous voice interview"]
Where to start
Take your current survey and sort every question into one of two columns: it measures, or it explains. Keep the measuring column as it is, those questions are enough. For the explaining column, pick twenty representative customers and put the same questions to them out loud, over a month.
The interview guide gives the structure and the wordings to avoid before you launch those twenty conversations. The ones to ask are in the bank of open-ended questions for qualitative research, grouped by goal. If the answers are meant to be used by an agent rather than a spreadsheet, the human in the loop post explains how to connect them.
Frequently asked questions
What questions should a customer satisfaction survey ask?
Include an overall satisfaction score, a recommendation question, an effort question about the last journey the person went through, two or three segmentation questions (tenure, usage frequency, main feature), a separate rating of the attributes that matter to you, and two open-ended questions. The ten exact wordings sit in the commented template, with what each one tells you and its limit.
What are the 5 levels of satisfaction?
Very dissatisfied, dissatisfied, neutral, satisfied and very satisfied. Keep levels 4 and 5 apart in your reporting. Thomas Jones and Earl Sasser measured at Xerox that very satisfied customers repurchased six times more than merely satisfied ones. Under a single label, the two levels stop predicting repurchase.
What are the 3 customer satisfaction metrics?
CSAT measures satisfaction with one specific interaction, from 1 to 5. NPS measures intent to recommend, from 0 to 10. CES measures the effort a journey demanded, from 1 to 7. All three track well over time and explain little. The work Keiningham and his co-authors published in the Journal of Marketing in 2007 shows that NPS predicts growth no better than classic satisfaction measures.
How do you introduce a customer satisfaction survey?
Say who is asking, why, how long it takes and where the answers go, in two sentences. Send the survey while the event is fresh, a day or two after. State an exact duration, because a two-minute promise broken at minute four gets the tab closed.
How many questions should a customer satisfaction survey have?
Count on eight to twelve questions for an in-depth survey, and one single question for a transactional pulse sent after a purchase or a ticket. Past twelve, the abandon rate climbs and the last answers get filled in at random. Every question you add should map to a decision you would take differently depending on the answer.
How do you build an effective customer satisfaction survey?
Start from the decision you have to take and work back to the questions that inform it, rather than listing everything that would be interesting to know. Keep the same wording quarter to quarter so the series stay comparable. Treat the free-text box as a bonus rather than as your source of explanations, since it gets filled in far less than a closed question, and go and find the why in conversation.


